Turn NAV into a market view
Reported NAV tells you where a position is marked. It does not necessarily tell you where it will trade.
Tangible combines portfolio data, buyer intelligence, comparable transactions and market feedback to develop an informed view of potential secondary pricing before a client decides whether to transact.
From valuation to decision
Four steps between a mark and a trade
01Indicative pricingEstimate where institutional buyers may price the position today.
02Buyer intelligenceUnderstand how strategy, vintage, unfunded exposure, distributions and manager quality affect demand.
03Sell vs HoldCompare the proceeds from selling today with the expected value of retaining the position.
04Process calibrationUse the analysis to determine reserve pricing, buyer selection and the appropriate transaction structure.
Product spotlight
Seller Return Analysis
Sell vs Hold: data-driven decision-making support
Leveraging Tangible’s privileged window into seller and buyer behaviour, we provide insight into how positions are likely to trade — so you can make an informed, data-driven decision on whether to hold or sell.
- Run and compareMultiple risk-free hold vs sell scenarios.
- Share the resultsWith other decision makers, with clear, exportable reporting.
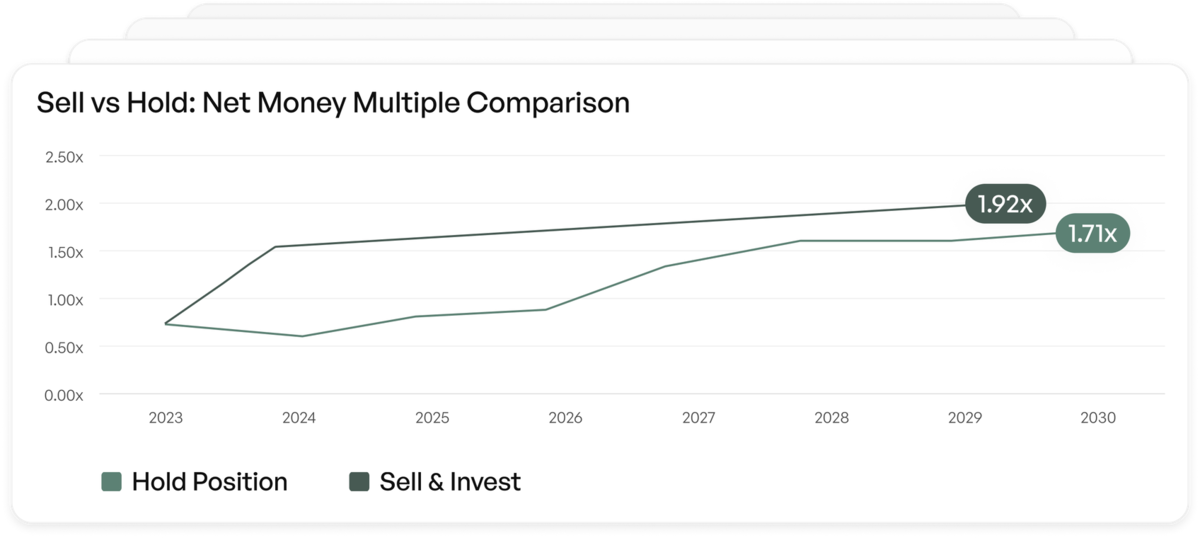
Illustrative example: Sell vs Hold analysis screen